Your inspection program generates data every single day. Condition ratings, defect photos, corrective action outcomes, maintenance findings. If your operation has been running a structured inspection management system for more than a year, you have thousands of records in your database.
Most of that data is never used for anything beyond generating a compliance report.
That is a significant problem. Not because compliance reports are unimportant, but because inspection data contains operational intelligence that most organizations never access. Failure predictions. Maintenance optimization opportunities. Health and safety risk patterns. Asset lifecycle insights.
Here are five signs your inspection data is being wasted, and what changes when you actually put it to work.
Sign 1: Your Team Is Always Reacting to Failures
If your maintenance team mainly responds to equipment failures instead of preventing them, then you are not using your inspection data effectively.
Inspection data collected over time contains the early warning signs of most equipment failures. Condition ratings that decline gradually before a failure. Defect patterns that precede breakdowns. Asset condition trends that are invisible in a single inspection but obvious when you look across a year of inspection history.
If nobody analyses these patterns, your team will continue facing failures that the data could have predicted.
Sign 2: Inspection Reports Get Filed and Never Read Again
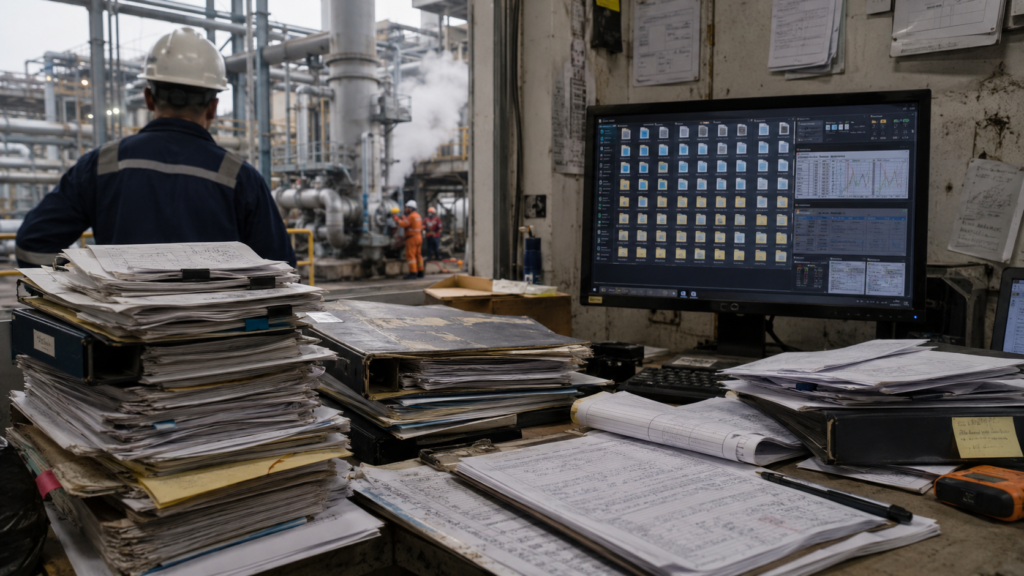
Talk to most operations managers and they will tell you the same thing. Inspection reports come in, critical findings get addressed, and the rest of the report gets filed in a database. Nobody goes back to look at the non-critical findings from six months ago to see if they have become a pattern.
If your inspection reports are essentially filing cabinets rather than analytical tools, you are collecting data without using it.
Sign 3: You Inspect Everything on the Same Schedule
Fixed schedules treat every asset equally, regardless of risk. For example, teams inspect a reliable pump as often as one that produces findings during every inspection cycle.
If your inspection schedule is based purely on calendar intervals rather than asset condition and risk data, you are not using your inspection history to inform where inspection effort should go.
Sign 4: Corrective Actions Are Prioritized by Who Asks Loudest
When a list of corrective actions comes out of an inspection cycle, how does your team decide what to fix first? If the answer is “whoever puts in the most urgent request” or “whatever the site manager is worried about this week” rather than “what the data says carries the highest risk and cost of inaction,” your corrective action management process is not using inspection data effectively.
Sign 5: You Cannot Answer Basic Questions About Your Asset Fleet
Can you tell, right now, which assets in your operation are showing the fastest condition decline? Which site has the highest corrective action backlog? Which asset type generates the most findings per inspection?
If answering those questions requires pulling data from multiple systems and compiling it manually, your inspection data management setup is not surfacing the insights that are sitting in your database.
What Changes When You Actually Use Your Inspection Data
Field Eagle AI Preventative Maintenance is the analysis layer that sits on top of your existing inspection platform and makes your data work for you. It analyses your accumulated inspection history to surface failure predictions, inspection optimization opportunities, risk-ranked corrective action priorities, and asset condition trends across your entire fleet.
Your inspectors keep working exactly as they always have. The AI works on the data behind the scenes and delivers the insights to a customised dashboard showing each manager exactly what their data is telling them.
Failure Prediction
The system flags assets that show deterioration patterns linked to previous failures before they become critical. Moreover, it provides specific actions and timelines instead of general alerts.
Inspection Schedule Optimization
Low-risk assets with consistent clean inspection histories can have their inspection frequency safely reduced. High-risk assets showing elevated deterioration rates receive more frequent attention. Inspection resources go where the risk is.
Data-Driven Corrective Action Priority
The system ranks repairs by risk and the cost of delaying action. Moreover, it uses historical failure patterns to set priorities. Your maintenance team sees the most consequential work at the top of the list automatically.
Fleet-Wide Condition Visibility
Every manager sees a dashboard configured for what they specifically need to see. The assets their team is responsible for, the risks most relevant to their role, the trends most likely to affect their asset management program.
The Compounding Benefit
Every inspection your team completes adds to the dataset the AI analyses. Every corrective action outcome teaches the model what patterns lead to what results. Over time, predictions become more precise and inspection schedule optimization becomes more targeted.
Organizations that start using AI analysis of their inspection data today are building a compounding advantage. The longer you run the analysis, the more accurate the predictions. The more accurate the predictions, the more effectively you can deploy maintenance resources.
The data your team has been collecting is not a compliance archive. It is an operational intelligence asset. AI Preventative Maintenance is what unlocks it.
Frequently Asked Questions
Consistency is the most important factor. If inspectors use structured checklists and condition ratings, while a centralized database stores the results, AI can likely analyse the data. Moreover, consistent practices across inspectors and sites improve accuracy. In contrast, unstructured data and inconsistent ratings reduce insight quality.
Organizations with significant inspection history in their database can begin seeing insights from the first analysis run. The quality of insights improves continuously as more data accumulates. An operation with two or more years of consistent inspection data will typically see more precise and specific predictions than one that has been collecting data for six months.
AI analysis works best with data in one structured database. Therefore, organizations should consolidate fragmented records in a single inspection management platform before analysis. Field Eagle AI analyses data collected through the Field Eagle platform.
Yes. Asset condition trending across the full inspection history reveals which assets are degrading faster than expected and approaching the point where continued maintenance is less cost-effective than replacement. This data-driven perspective on asset lifecycle is much more accurate than replacement decisions based on age alone.
The AI identifies site conditions and asset combinations that represent elevated health and safety risk based on historical incident patterns, not just current inspection findings. Risks that look unremarkable in a single inspection become visible when the AI connects them to patterns across hundreds of previous inspections. This means hazards are identified and addressed before incidents occur.