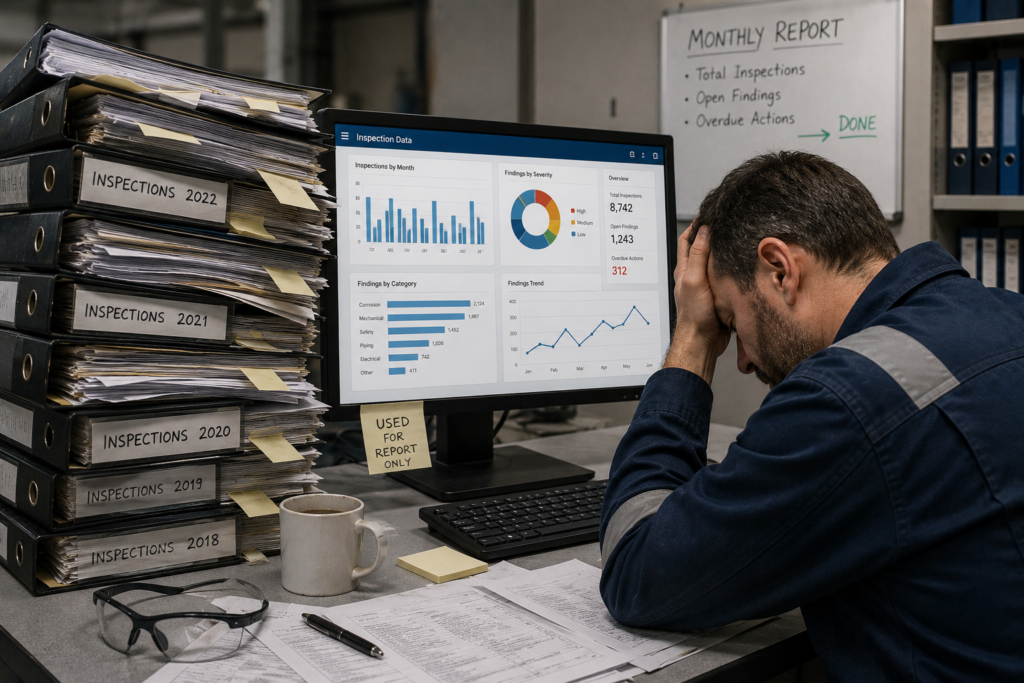
Most industrial inspection programs have the same problem. They generate thousands of records every year. Condition ratings, defect photos, corrective action outcomes, compliance documentation. The data exists. The database is full. But when you ask an operations manager what the data is actually telling them about their asset fleet, the honest answer is usually: not much.
This is not a data problem. It is a system problem. And it is more common than most operations teams want to admit.
The Report Generation Trap
Most inspection programs focus on generating reports. An inspector completes a field inspection and the system produces a report. The report goes to a manager. The manager checks it for critical findings, addresses those, and files the report. The inspection cycle repeats.
This works for compliance. It does not work for operational intelligence.
The problem is that a single inspection report is a snapshot. It tells you the condition of an asset at one point in time. What it does not tell you is whether that condition is getting better or worse, how fast, and what the pattern of change suggests about when you need to act.
That information is in the data. It just requires looking across many inspections over time, not reviewing each report in isolation.
Why Nobody Goes Back and Reads the Old Reports
Inspection reports pile up quickly. An operation with 50 assets inspected monthly generates 600 reports per year. Nobody has time to review all of those reports looking for trends. The team addresses the critical finding identified in this month’s report. The borderline finding that has appeared in the last four reports without quite crossing the critical threshold stays borderline.
Until it crosses the threshold. Then it becomes an emergency.
Organizations incur operational costs when they collect data for reports but cannot use it for meaningful analysis. The inspection data management capability that most programs lack is not better reports. It is the ability to look across reports to see patterns.
The Three Gaps That Cause Inspection Data to Go Unused
Gap 1: Data Is in the Right Place But the Wrong Format
Many inspection programs store data in a database but in a format that is not easily queryable. If finding a deterioration trend requires pulling multiple reports, copying data into a spreadsheet, and building a chart manually, it is not going to happen for most assets in most inspection cycles. The analytical friction is too high.
Gap 2: Nobody Owns the Analysis
Inspection programs typically assign ownership for inspection completion. Organizations usually assign someone to ensure teams complete each inspection. However, they less often assign clear responsibility for analyzing the data across multiple inspection cycles.. If nobody is accountable for turning inspection data into operational insights, the insights will not reliably emerge.
Gap 3: The Volume Overwhelms Manual Analysis
Even with the right format and the right ownership, manual analysis of inspection data at scale is not feasible. An operations manager responsible for 200 assets cannot meaningfully trend the condition history of each asset manually every month. The volume of data that systematic inspection programs generate simply exceeds the capacity for manual analysis.
What Inspection Data Should Be Doing
Inspection data should be answering several questions that most programs currently leave unanswered:
- Which assets are showing the fastest condition decline across inspection cycles?
- Which corrective action findings continue to reappear after teams address them?
- Which sites or asset types generate the most findings per inspection?
- Which assets are approaching the condition threshold that requires major intervention?
- Which inspection categories show the highest rates of non-compliance?
These questions have answers sitting in most inspection databases right now. The data is there. The problem is making it accessible and actionable without requiring someone to manually compile it from individual inspection reports.
How AI Analysis Changes the Picture
Field Eagle AI Preventative Maintenance addresses all three gaps directly. The AI analyses inspection data across inspection cycles automatically, without requiring manual data compilation. It identifies deterioration trends, recurring findings, and failure patterns that are invisible in individual inspection reports. And it delivers those insights to a customised dashboard that shows each manager exactly what their data is telling them.
Teams no longer need to analyze the data manually, compile spreadsheets, or wait for someone to review the inspection history.
Your inspectors keep working exactly as they always have. The AI works on the data behind the scenes and surfaces the patterns that matter.
Failure Prediction From Pattern Recognition
The AI identifies assets showing deterioration patterns consistent with previous failures in your operation’s history. Not general failure risk based on age or type, but specific pattern matches to your actual failure history. The system flags assets showing these patterns and recommends corrective actions before the assets reach critical status.
Corrective Action Prioritization by Data
Instead of prioritizing corrective actions by who raises them most urgently, the AI ranks them by risk level and cost of inaction based on historical failure patterns. The maintenance team sees the most consequential work at the top of the list without requiring manual risk assessment of every finding.
Inspection Schedule Optimization
The AI identifies which assets consistently show low risk across inspection cycles, where inspection frequency can be safely reduced. It also identifies high-risk areas that need more attention than current schedules provide. The inspection program becomes more efficient without becoming less safe.
Getting Started: Making Your Inspection Data Work
The first step is to collect inspection data consistently in a structured digital format. Paper-based programs cannot support effective analysis at scale, regardless of how much data they generate.
The second step is centralizing that data in a single inspection management system rather than across disconnected spreadsheets and filing systems. Data that is fragmented cannot be analysed as a whole.
The third step is applying AI analysis to the accumulated data to surface the patterns, predictions, and priorities that manual review cannot produce.
If your inspection program is already running on Field Eagle, the data your team has been collecting is already in the right place. The AI analysis layer can begin working on it immediately.
Frequently Asked Questions
Most programs focus on compliance rather than operational analysis. Although they confirm inspection completion, they rarely reveal trends across inspections. Moreover, growing data volumes make manual analysis impractical, so valuable insights remain buried in individual reports.
Inspection data includes raw findings, condition ratings, and measurements. In contrast, inspection intelligence emerges when teams analyse this data across assets and time to identify patterns, trends, and predictions.
AI can identify patterns in existing inspection records. However, more historical data generally produces more precise insights. Two years of consistent data may support stronger predictions than six months, although the analysis remains useful from the beginning and improves as data accumulates.
Yes. Although inconsistent data reduces accuracy, AI can still produce useful insights. Therefore, organizations should standardize condition ratings and structured digital checklists to improve future analysis while still using available historical data.
With AI-powered tools, automated dashboards can deliver relevant insights to each manager. Otherwise, organizations should assign trend analysis to a specific HSE manager, operations analyst, or maintenance engineer.